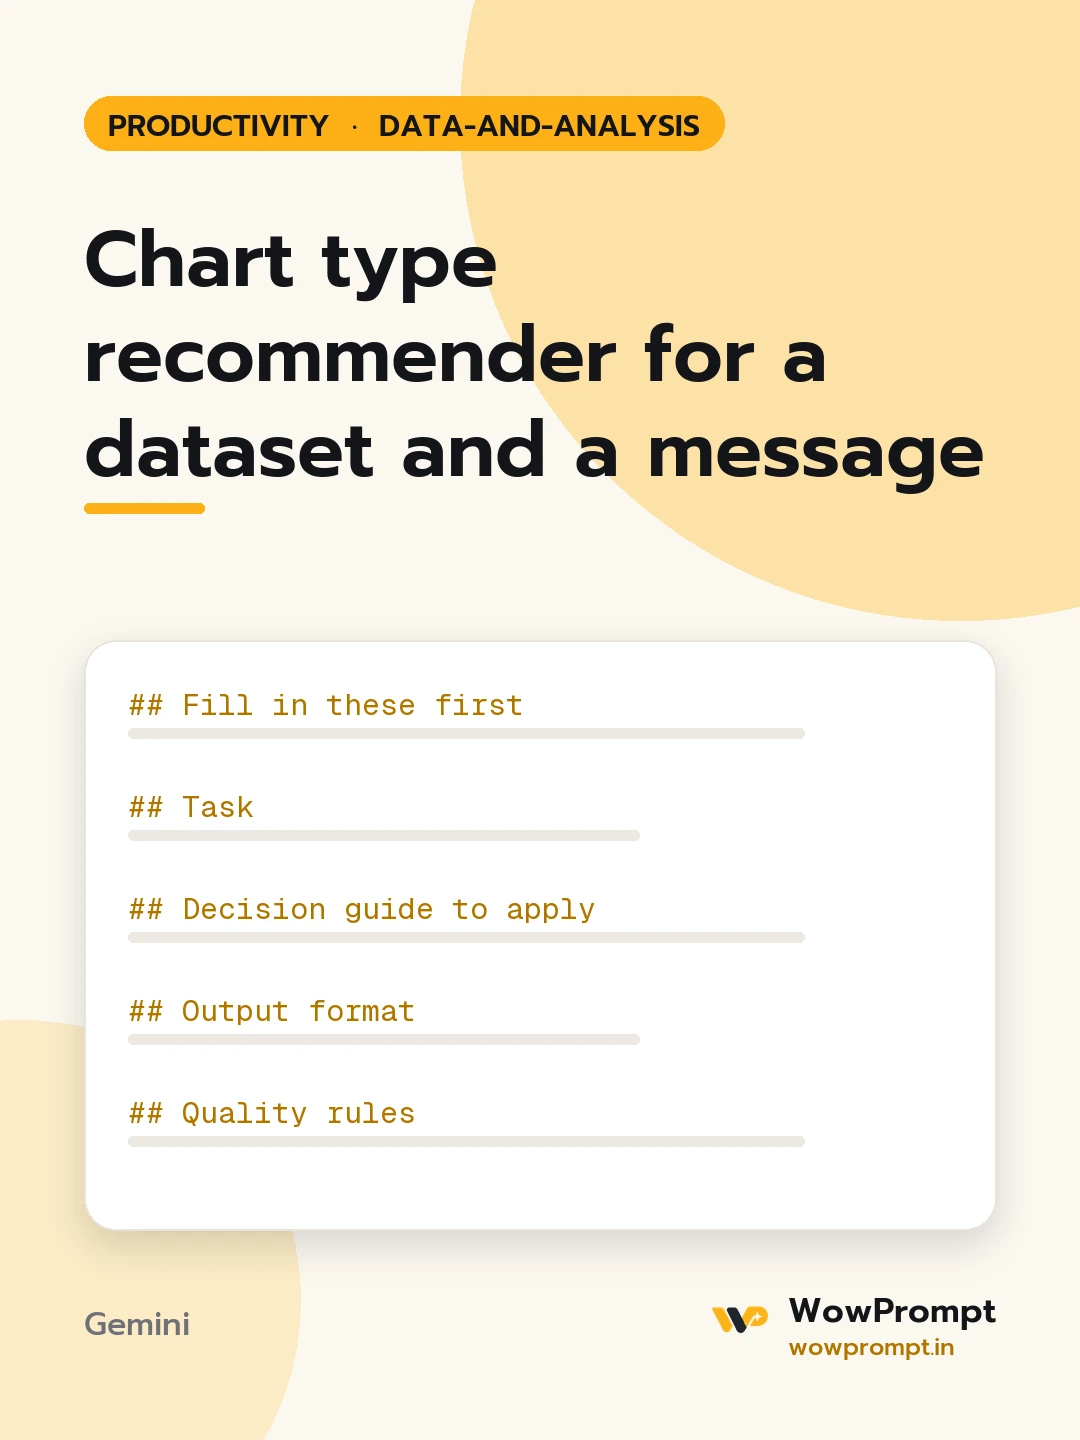
Fill in these first
- The message the chart must make: [e.g. returns rose after the courier change in July]
- Audience: [e.g. operations leads, in a slide deck]
- Data columns: [column names with type: date, category, number, percentage]
- Number of categories or series: [e.g. 4 regions]
- Number of data points: [e.g. 12 months]
- Where it will appear: [slide, report page, dashboard tile, mobile screen]
Task
Recommend the single chart that makes the message clearest, and specify it in enough detail to build without guessing.
Decision guide to apply
- Change over time: line chart, or column chart for under eight periods.
- Comparing categories: horizontal bar chart, sorted.
- Part of a whole: stacked bar, or a pie only with four or fewer slices.
- Relationship between two numbers: scatter plot.
- Distribution: histogram or box plot.
Output format
- Recommended chart and a one-line reason.
- Specification:
| Element | Choice |
Cover x-axis, y-axis, series, sort order, colour use, labels, gridlines and the starting value of the y-axis.
- Title: written as the takeaway, under 12 words.
- Annotation: one note to place on the chart and where.
- Two alternatives, each with when it would be the better pick.
- Avoid: three mistakes that would weaken this specific chart.
Quality rules
- One highlight colour for the point of the message; grey for the rest.
- Bar charts start at zero.
- No 3D effects, no dual axes unless the reason is stated.
- Labels are readable at the stated size.




