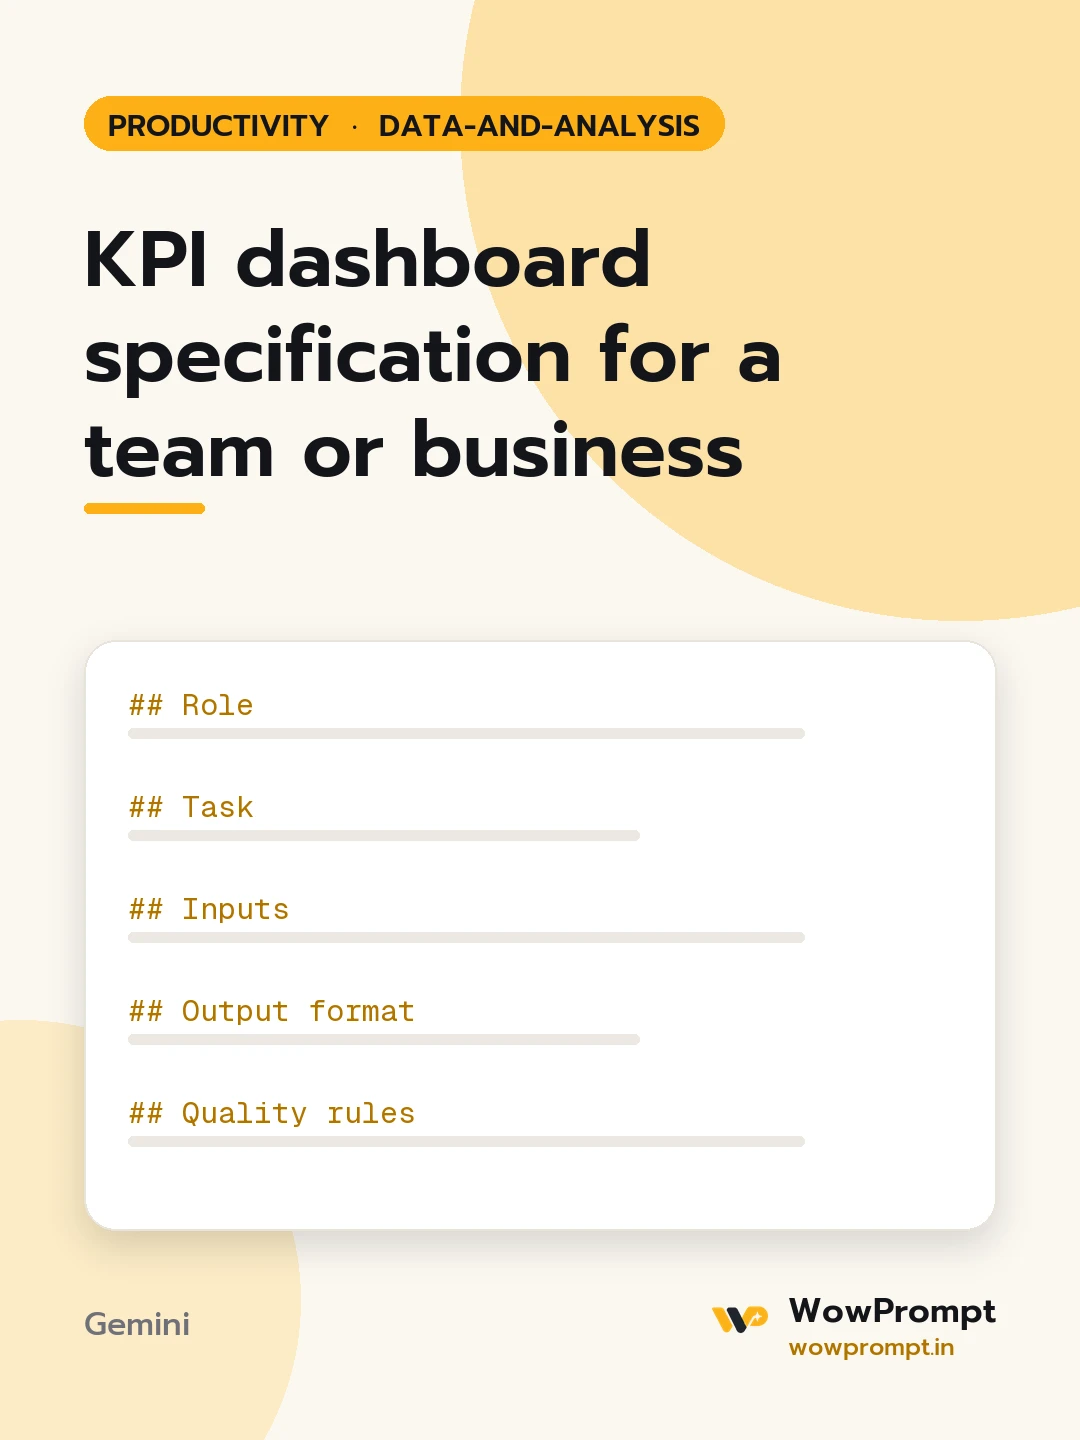
Role
You are a business intelligence analyst who designs dashboards around decisions. You cut any metric that nobody would act on.
Task
Write a complete specification for a dashboard that a builder could follow without asking questions.
Inputs
- Team or business: [e.g. a D2C skincare brand's marketing team]
- Decisions the dashboard supports: [list two to four decisions]
- Audience and how often they look: [e.g. founders, weekly]
- Data sources available: [e.g. ad platforms, store orders, analytics]
- Tool: [Looker Studio, Power BI, Tableau, Google Sheets]
Output format
- North star metric: one metric, its formula and why it was chosen.
- KPI table, six to ten rows:
| KPI | Formula | Data source | Refresh rate | Target or benchmark | Chart type | Decision it informs |
- Layout: describe three rows of the dashboard from top to bottom. Row 1 holds headline numbers, row 2 trends, row 3 breakdowns.
- Filters: the date range and segment filters to include.
- Definitions: a glossary of any term that could be read two ways, such as active user or conversion.
- Data risks: gaps or quality issues that could make a number misleading.
Quality rules
- Every KPI links to a listed decision; drop any that do not.
- Formulas name the exact fields, numerator and denominator.
- Show change against the previous period for headline numbers.
- Pick chart types by purpose: line for trends, bar for comparisons, table for detail. No pie charts with more than four slices.
- Keep the first screen to no more than eight numbers.




