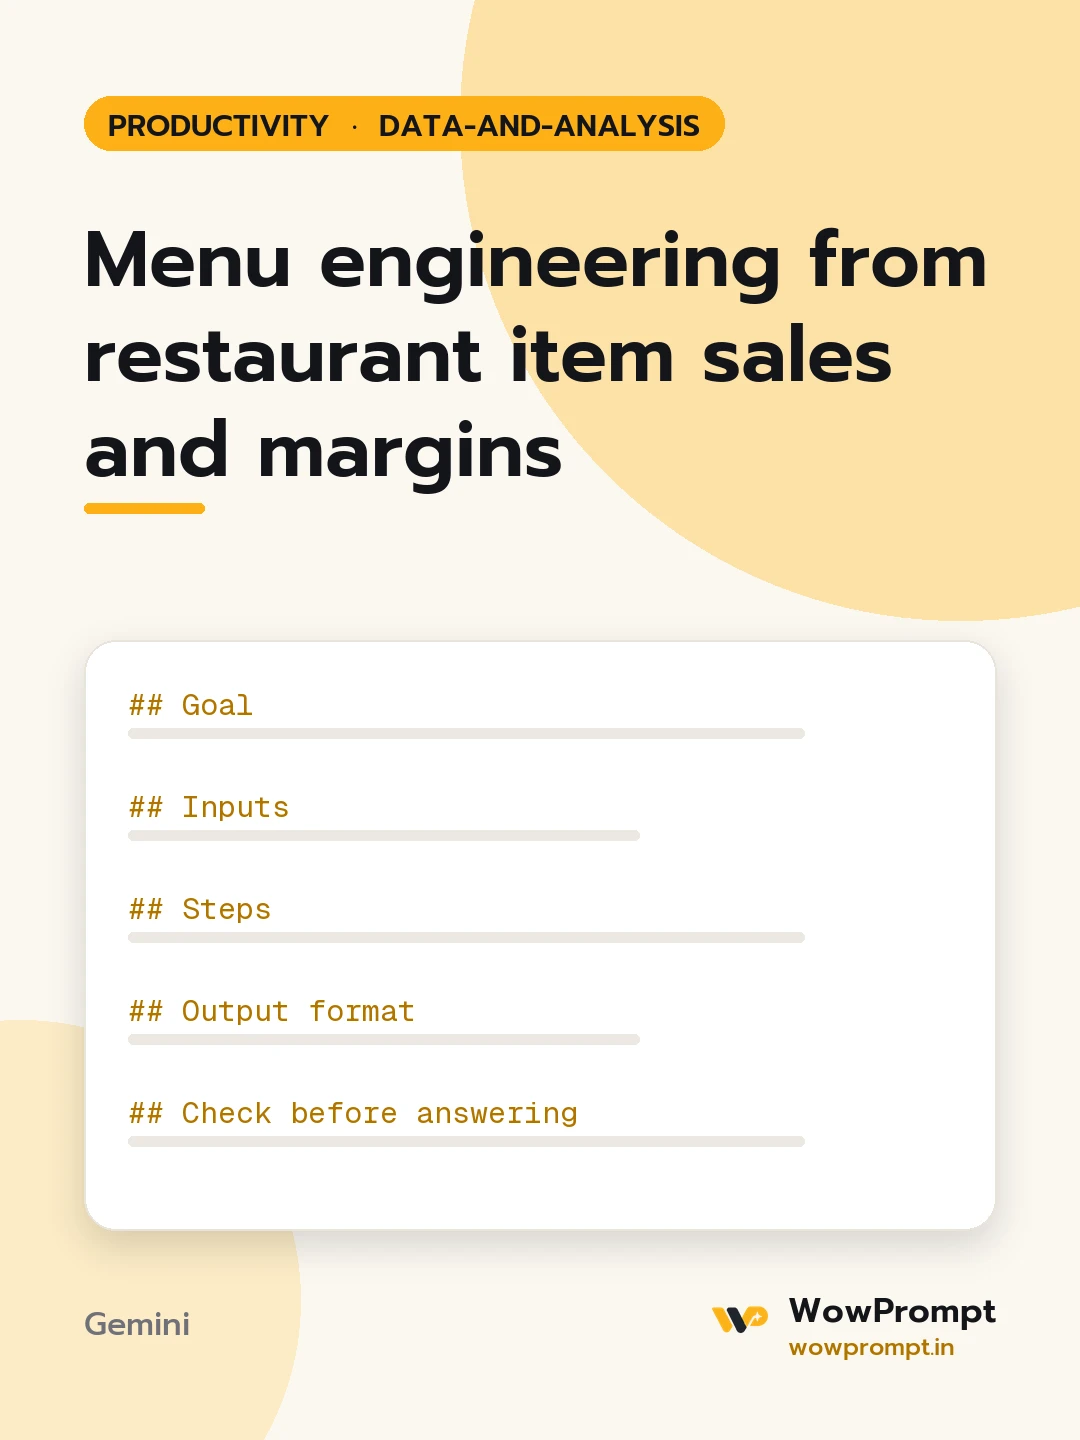
Goal
Know which dishes earn their place on the menu and what to change for each one.
Inputs
- Restaurant type and service: [e.g. cafe with dine-in and delivery, North Indian family restaurant]
- Period: [e.g. last 30 days]
- Items: [one row each with menu section, item name, selling price, food cost per plate and units sold]
- Delivery commission, if items sell on apps: [e.g. 25% on delivery orders, or none]
- Constraints: [e.g. signature dishes we will not remove, kitchen station limits]
Steps
- Compute contribution margin per item: selling price minus food cost (and commission where it applies).
- Compute each item's share of units sold within its menu section.
- Mark popularity as high when the share is at least 70% of an equal share (100% divided by the number of items, times 0.7).
- Mark margin as high when it is at or above the section's weighted average margin.
- Classify: star (high, high), plowhorse (popular, low margin), puzzle (high margin, unpopular), dog (low, low).
Output format
- | Section | Item | Price | Food cost | Margin | Units | Popularity | Margin level | Class |
- Count of items in each class per section.
- Actions: stars (protect, keep prominent), plowhorses (small price rise or cheaper garnish), puzzles (rename, move up, staff recommendation), dogs (rework or remove).
- The three changes with the largest monthly profit effect, with the arithmetic.
Check before answering
- Every figure comes from the pasted rows.
- Sections are analysed separately; desserts are not compared with main courses.
- Price suggestions are small steps, not jumps that change the dish's position on the menu.
- Removing a dish is never the only option offered.




