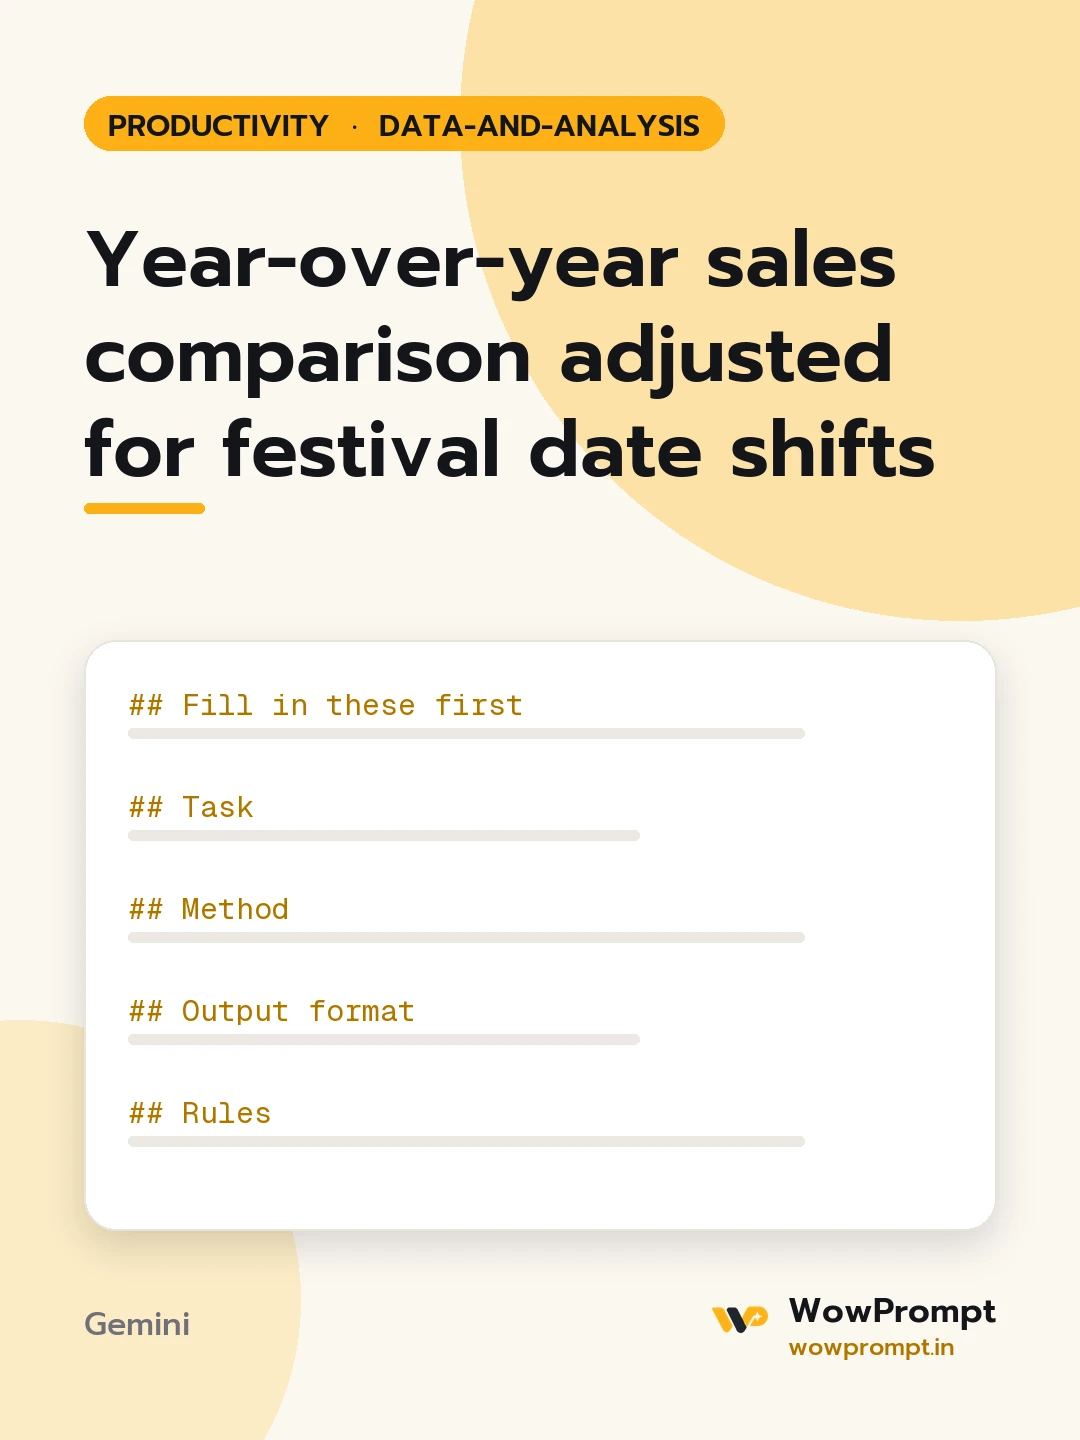
Fill in these first
- Daily sales for both years: [paste as date, sales value, orders]
- Festivals in the window and their dates each year: [e.g. Diwali 1 November last year, 20 October this year]
- Other differences between the years: [e.g. sale started earlier, one extra weekend, new store opened]
- Reporting window: [e.g. October and November, or 30 days before to 10 days after Diwali]
- Measure that matters most: [sales value, orders, or average order value]
Task
Show how much growth is real once the festival dates are lined up.
Method
- Calendar view: compare the same calendar dates in both years.
- Aligned view: label every day by days before or after the festival (D-30 to D+10) and compare like with like.
- Weekday check: note where aligned days fall on different weekdays and whether weekends shift the result.
- Separate the festival window from the rest of the period so a shift does not distort the whole month.
Output format
- | Day relative to festival | Date last year | Sales last year | Date this year | Sales this year | Change % |
- | View | Last year total | This year total | Growth % | for the calendar and aligned views.
- A chart description: two lines on the aligned day axis, with the festival day marked.
- Three sentences for a manager on what the true growth is and why the calendar figure differs.
Rules
- Do not guess festival dates; use only those given, and ask if one is missing.
- Keep both views visible; never report only the more flattering one.
- Flag any day with missing data rather than filling it in.




